With the 2024 US Presidential election a few weeks away, financial headlines will likely start to look a lot like political headlines. All sorts of agendas will suggest that a Harris/Trump presidency will be good/bad for stocks and investors should take action in their portfolios to protect themselves.
By and large (at least compared to other advisors I speak with), our client base is very level-headed and rational about the connection (or lack thereof) between politics and investments. While we each may have strong opinions about how the ramifications one party or the other may have on societal or geopolitical policymaking, I think we do a good job of separating those emotions from how we feel about our investment portfolios.
However, one common refrain we hear as an election season approaches, particularly when contemplating a large sum of cash, is something like: “With the election coming up, I’d rather just wait and see what happens.”
We shared this graph last quarter, but I wanted to take a moment to look at the results in a bit more depth. The image below represents every monthly return of the S&P 500 since 1926 stacked according to where that monthly return falls in 1% increments. Each individual month is represented by a gray dash for a non-election month, a red dash for a presidential election won by a Republican, and a blue dash for a presidential election won by a Democrat. As an example, the tallest stack on this graph results from when the S&P 500 has returned 1% to 2% in a given month. This has occurred 137 times, two of which were months where a Democrat won the presidency.
I think this graph does a good job of visually illustrating that market returns seem to have little correlation with presidential election results or the presence of an election itself, but let’s look at the actual averages.
Election Months
All Months
Average Monthly Return
1.77%
0.97%
Average Standard Deviation
5.69%
5.36%
*Data Source: Standard & Poor. Data from 2/1/1926 to 12/31/2023.
The S&P 500 has exhibited higher performance during presidential election months compared to “normal” months. However, this observation is not significant enough to impact an investment strategy. Markets are slightly more volatile in election months, but the difference in volatility is immaterial. This would suggest that neither elections, nor their outcomes, should be a variable in decision-making when it comes to implementing or adjusting an investment strategy.
For those wondering, the elections years on the tails of this graph are:
• November 1928: 12.92% (Hoover)
• November 1980: 10.95% (Reagan)
• November 2020: 10.95% (Biden)
• November 1948: -9.61% (Truman)
• November 2000: -7.88% (George W. Bush)
• November 2008: -7.18% (Obama)
Interest Rate Cuts
Last month, the Federal Reserve made its first cut to interest rates since the onset of the Pandemic with a 0.50% drop in the federal funds rate. Comments made by Federal Reserve Chairman Jerome Powell, suggests that further cuts will follow in the coming months with an expectation that they will pursue a target range of 3.00-.25% over the course of about 9-12 months. This would represent total interest rate reductions of 2% from the peak we have just come off of.
A theme of these newsletters for the last year has been about how hilariously unpredictable interest rate moves have been. So, expectations around what the future may hold should be taken with a spoonful of salt. That said, our baseline expectation is that we will see several more cuts in rates from the upcoming Federal Reserve meetings.
If rates do fall significantly over the coming year, we would hope this will bring a reprieve to the current state of housing affordability. Whether or not that translates to improvements in the overall economy is anyone’s guess. But, the pain being felt by anyone who doesn’t already own a home (or anyone that wants to move into a new home) can’t be ignored.
Historically, rate cuts have been a boon to intermediate-duration bonds as well as small and value stocks. The graphs below illustrate that falling rate environments have, historically, been strong for returns for both of these characteristics compared to rising rate market environments.
Figure 1 – Source: Avantis Investors, Bloomberg, FRED. Data from 1/1/1986 – 8/30/2024. Number of six-month periods when rates rise by >1% are 56, when rates stay within +/- 1% are 332, and when rates fall by >1% are 71. Past performance is no guarantee of future results.
Figure 2 – Source: Avantis Investors, Ken French Data Library, FRED. Data from 1/1/1976 – 8/30/2024. The U.S. stock market is represented by the Market Portfolio and Small Cap Value by the Small Value Portfolio from the Ken French Data Library. The number of six-month periods when rates rise is 303, and when rates fall is 248. Past performance is no guarantee of future results.
While the actual path of interest rates, as well as the market’s behavior when these moves occur, is never a guarantee, guidance from the Federal Reserve suggests that the current federal funds rate is well above the “normal” they would like to see. As the data shows us, periods of rapidly falling rates have benefited investors that have extended duration in their fixed income allocations beyond cash and money market funds. And, as we believe is true irrespective of the direction of rates, equity allocations that tilt toward smaller companies with lower price-to-book ratios is expected to increase expected returns, and we would expect that effect to be even more impactful when rates are going down.
As we wrap up this edition of our newsletter, we want to take a moment to acknowledge the recent hurricane disasters that have impacted so many lives. Our thoughts are with those affected by hurricanes Helene and Milton, and we stand in solidarity with the communities working to rebuild.
In times like these, resilience and support are more important than ever. Please stay safe, and know that we are here for you as we move forward together.
Past performance is no guarantee of future results.
This newsletter contains general information that may not be suitable for everyone. The information contained herein should not be construed as personalized investment advice. Past performance is no guarantee of future results. There is no guarantee that the views and opinions expressed in this newsletter will come to pass. Investing in the stock market involves gains and losses and may not be suitable for all investors. Information presented herein is subject to change without notice and should not be considered as a solicitation to buy or sell any security. Investment advisory services offered through Ferguson-Johnson Wealth Management, a registered investment adviser.

Presidents & Interest Rates
By: Ferguson-Johnson Wealth Management | October 22, 2024
With the 2024 US Presidential election a few weeks away, financial headlines will likely start to look a lot like political headlines. All sorts of agendas will suggest that a Harris/Trump presidency will be good/bad for stocks and investors should take action in their portfolios to protect themselves.
By and large (at least compared to other advisors I speak with), our client base is very level-headed and rational about the connection (or lack thereof) between politics and investments. While we each may have strong opinions about how the ramifications one party or the other may have on societal or geopolitical policymaking, I think we do a good job of separating those emotions from how we feel about our investment portfolios.
However, one common refrain we hear as an election season approaches, particularly when contemplating a large sum of cash, is something like: “With the election coming up, I’d rather just wait and see what happens.”
We shared this graph last quarter, but I wanted to take a moment to look at the results in a bit more depth. The image below represents every monthly return of the S&P 500 since 1926 stacked according to where that monthly return falls in 1% increments. Each individual month is represented by a gray dash for a non-election month, a red dash for a presidential election won by a Republican, and a blue dash for a presidential election won by a Democrat. As an example, the tallest stack on this graph results from when the S&P 500 has returned 1% to 2% in a given month. This has occurred 137 times, two of which were months where a Democrat won the presidency.
Monthly Returns for the S&P 500, 1926 – 2023
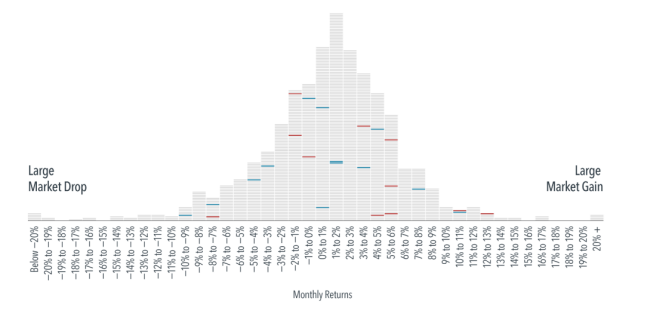 *Chart: Dimensional Fund Advisors. Data as of 12/31/2023. In USD. Dashes representing returns for a given month are stacked in ascending order of return within each column, with highest return within that range on top. S&P data © 2024 S&P Dow Jones Indices LLC, a division of S&P Global. All rights reserved. Indices are not available for direct investment.Their performance does not reflect the expenses associated with the management of an actual portfolio.
I think this graph does a good job of visually illustrating that market returns seem to have little correlation with presidential election results or the presence of an election itself, but let’s look at the actual averages.
*Data Source: Standard & Poor. Data from 2/1/1926 to 12/31/2023.
The S&P 500 has exhibited higher performance during presidential election months compared to “normal” months. However, this observation is not significant enough to impact an investment strategy. Markets are slightly more volatile in election months, but the difference in volatility is immaterial. This would suggest that neither elections, nor their outcomes, should be a variable in decision-making when it comes to implementing or adjusting an investment strategy.
For those wondering, the elections years on the tails of this graph are:
• November 1928: 12.92% (Hoover)
• November 1980: 10.95% (Reagan)
• November 2020: 10.95% (Biden)
• November 1948: -9.61% (Truman)
• November 2000: -7.88% (George W. Bush)
• November 2008: -7.18% (Obama)
Interest Rate Cuts
Last month, the Federal Reserve made its first cut to interest rates since the onset of the Pandemic with a 0.50% drop in the federal funds rate. Comments made by Federal Reserve Chairman Jerome Powell, suggests that further cuts will follow in the coming months with an expectation that they will pursue a target range of 3.00-.25% over the course of about 9-12 months. This would represent total interest rate reductions of 2% from the peak we have just come off of.
A theme of these newsletters for the last year has been about how hilariously unpredictable interest rate moves have been. So, expectations around what the future may hold should be taken with a spoonful of salt. That said, our baseline expectation is that we will see several more cuts in rates from the upcoming Federal Reserve meetings.
If rates do fall significantly over the coming year, we would hope this will bring a reprieve to the current state of housing affordability. Whether or not that translates to improvements in the overall economy is anyone’s guess. But, the pain being felt by anyone who doesn’t already own a home (or anyone that wants to move into a new home) can’t be ignored.
Historically, rate cuts have been a boon to intermediate-duration bonds as well as small and value stocks. The graphs below illustrate that falling rate environments have, historically, been strong for returns for both of these characteristics compared to rising rate market environments.
Figure 1 – Source: Avantis Investors, Bloomberg, FRED. Data from 1/1/1986 – 8/30/2024. Number of six-month periods when rates rise by >1% are 56, when rates stay within +/- 1% are 332, and when rates fall by >1% are 71. Past performance is no guarantee of future results.
Figure 2 – Source: Avantis Investors, Ken French Data Library, FRED. Data from 1/1/1976 – 8/30/2024. The U.S. stock market is represented by the Market Portfolio and Small Cap Value by the Small Value Portfolio from the Ken French Data Library. The number of six-month periods when rates rise is 303, and when rates fall is 248. Past performance is no guarantee of future results.
While the actual path of interest rates, as well as the market’s behavior when these moves occur, is never a guarantee, guidance from the Federal Reserve suggests that the current federal funds rate is well above the “normal” they would like to see. As the data shows us, periods of rapidly falling rates have benefited investors that have extended duration in their fixed income allocations beyond cash and money market funds. And, as we believe is true irrespective of the direction of rates, equity allocations that tilt toward smaller companies with lower price-to-book ratios is expected to increase expected returns, and we would expect that effect to be even more impactful when rates are going down.
As we wrap up this edition of our newsletter, we want to take a moment to acknowledge the recent hurricane disasters that have impacted so many lives. Our thoughts are with those affected by hurricanes Helene and Milton, and we stand in solidarity with the communities working to rebuild.
In times like these, resilience and support are more important than ever. Please stay safe, and know that we are here for you as we move forward together.
Past performance is no guarantee of future results.
This newsletter contains general information that may not be suitable for everyone. The information contained herein should not be construed as personalized investment advice. Past performance is no guarantee of future results. There is no guarantee that the views and opinions expressed in this newsletter will come to pass. Investing in the stock market involves gains and losses and may not be suitable for all investors. Information presented herein is subject to change without notice and should not be considered as a solicitation to buy or sell any security. Investment advisory services offered through Ferguson-Johnson Wealth Management, a registered investment adviser.
Don’t be Shy
Download Market Commentary as a PDFJust Say Hi