

“Every past decline looks like an opportunity; every future decline looks like a risk.”
-Morgan Housel
As we close the book on 2021, another year of generally excellent investment returns, we revisit the recurring anxiety of “what if this is the peak?”
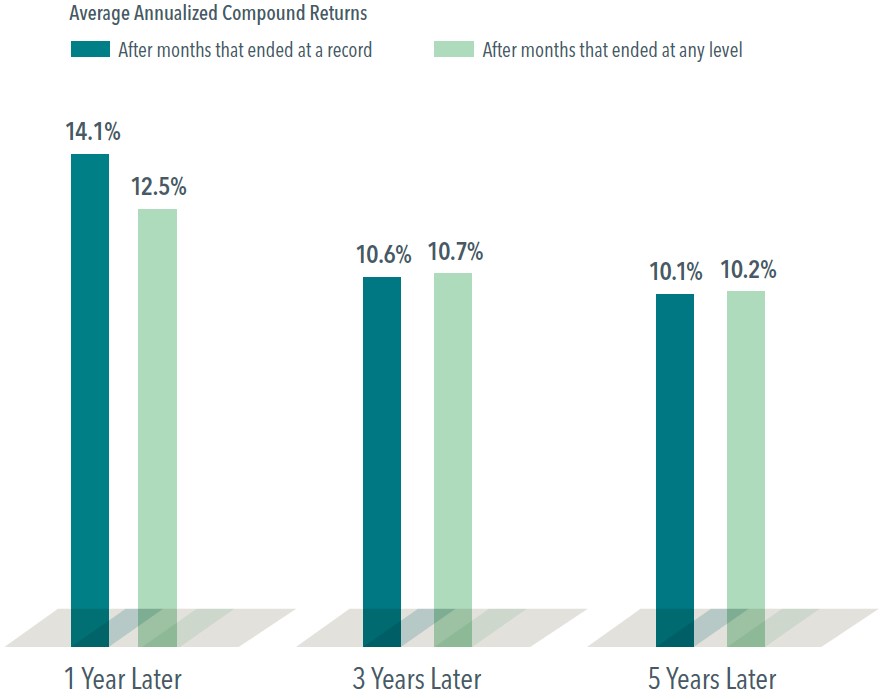
It’s certainly not an uncommon feeling. Many investors may think a market high is a signal that stocks are overvalued or have reached a ceiling. However, they may be surprised to find that the average returns one, three, and five years after a new month-end market high are similar to the average returns over any one-, three-, or five-year period:
Source: Dimensional Fund Advisors, S&P 500 Index Returns 1916-2021.
Reaching a new high doesn’t mean the market is destined to retreat. Stocks are priced to deliver a positive expected return for investors, so reaching record highs regularly is the outcome one would expect. New highs are necessary for long-term investors to make money in the markets.
As such, it’s a good thing that markets have been constantly achieving new highs. Here’s the number of new all-time highs that were hit per year over the past decade:
| Year | # of New Closing Record Highs |
| 2012 | 0 |
| 2013 | 45 |
| 2014 | 53 |
| 2015 | 10 |
| 2016 | 18 |
| 2017 | 62 |
| 2018 | 19 |
| 2019 | 36 |
| 2020 | 33 |
| 2021 | 70 |
Source: Morningstar S&P 500, 1/1/2012 – 12/31/2021.
As I’m sure you’re aware, January has been anything but kind to investors, so far – seemingly refuting the evidence laid out above. But, we know when investing in financial markets that drawdowns are a possibility. Much like the regularity of new market highs above, we see regularity with market drawdowns, as well.A new all-time high isn’t a unique occurrence or uncharted territory – it’s kind of the norm.
Going back to 1950, we have seen a drawdown of at least 5% in nearly every year. Even declines of greater than 10% have been observed in most calendar years.
| Magnitude of Decline | Frequency |
| 5% or more | 96% of years |
| 10% or more | 62% of years |
| 20% or more | 25% of years |
| 30% or more | 10% of years |
| 40% or more | 4% of years |
Source: Morningstar S&P 500, 1/3/1950 – 12/31/2021
There’s a lot weighing on markets: Will inflation continue? Will the Federal Reserve tighten monetary policy, raising interest rates? Will new tax legislation ever happen? What about COVID? Climate change? China? Tensions around Russia and Ukraine? Cryptocurrencies? Meme stocks? SPACs?
I get it – It’s a lot. But, it’s always a lot. Remembering the Morgan Housel quote at the top: “Every past decline looks like an opportunity; every future decline looks like a risk.”
Less than two years ago, we were in the early days of the COVID-19 Pandemic. People were afraid to leave their house. We left packages by the front door for several days to “disinfect”. We stood around in socially-distanced circles with neighbours for “happy hour” on Friday evenings (I kind of miss that part of it, actually).
Anyway, the S&P 500 fell 34% in the span of a month. Since then, the index had gained 114% to the most recent high that was hit on January 3rd1. Unintuitively, it turned out to be a marvelous investment opportunity, but it certainly didn’t feel that way in the moment.
The markets today may seem scary. The truth is the magnitude of a correction, when it will occur, and how long it will last is unknown. Have we already taken the first steps toward a depression?
Or will we be achieving new highs again in February or March? I can’t say. I’m pretty confident that however things play out, we will look back on this period with the same attitude of “well, that ended up being a good investment opportunity.”
We allocate the investment portfolios we build based on the capacity each individual client has to bear risk. Those portfolios are built with the expectation of declines. The financial plans are built with the expectation of declines.
The retirements we forecast are not an elaborate house of cards that fold as soon as the wind changes direction. If the anxiety and worry become too much to handle, then let’s explore what it really means for you.
1 Source: Morningstar. Data from 2/19/2020 to 12/31/2021.
If you’re looking for a wealth manager and financial advisor that puts you first, call Ferguson-Johnson Wealth Management today!
CONTACT US
 Optimized by Seraphinite Accelerator