It’s been grizzly out there. Times like these give me a chance to share my absolute favorite quote about markets. From Bill Bernstein’s book, he recalls how investor Ralph Wagoner explained markets:
“He likens the market to an excitable dog on a rather long leash in New York City, darting randomly in every direction. The dog’s owner is walking from Columbus Circle, through Central Park, to the Metropolitan Museum.
At any one moment, there is no predicting which way the pooch will lurch. But in the long run, you know he’s heading northeast at an average speed of three miles per hour. What is astonishing is that almost all of the market players, big and small, seem to have their eye on the dog, and not the owner.”
U.S. equity markets have had an unprecedented run of low volatility. In our most recent market commentary, we shared a fascinating fact about markets in 2017. In the calendar year, the S&P 500 only had eight daily moves in excess of 1.0%, up or down.
The average number of daily movements in excess of 1.0% in a given year is fifty. Furthermore, the frequency in which markets hit new highs and the consistency of markets remaining within a few points of all-time highs was dumbfounding.
Over the past 202 consecutive trading days, the S&P 500 was at or within 3% of its all-time highs. This was the longest such streak in the history of U.S. markets. To give some context to this stellar run, the second longest such streak, occurring in the mid 1990’s, lasted half as long.
All data – Source: S&P 500 Index accessed from Yahoo Finance as of 12/31/2017
2017 was an extremely abnormal year in the markets, declines as we have seen in the past week, are much more par for the course. In a given year, markets average a decline of 14% at over some period during the year.
The chart below illustrates this fact. For each year, the blue bar displays the total, calendar year return of the Russell 3000 (a good proxy index for the entire US market, including small companies that are excluded from the S&P 500).
The black/red line overlaid for each year shows the maximum gain and drawdown within that year.
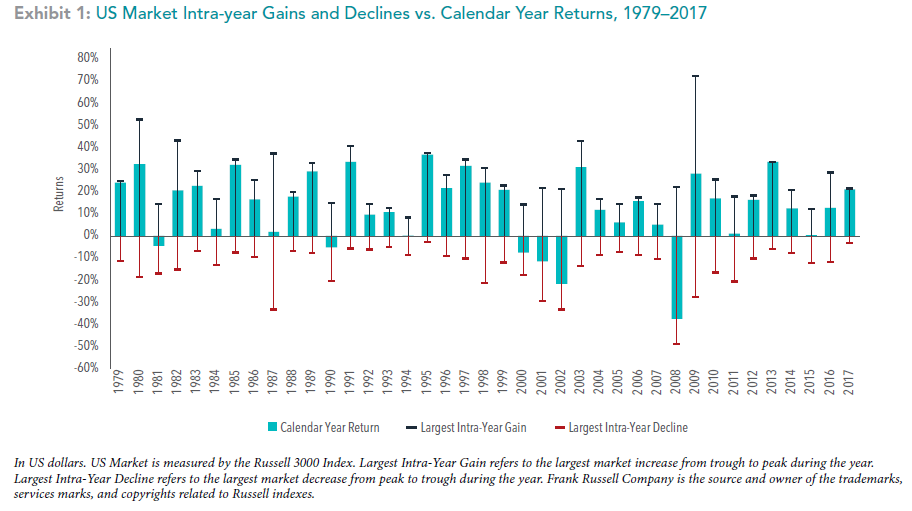
As you can see, we should expect declines like this on, basically, an annual basis. Of the 39 years included in this graph, despite sometimes very large intra-year declines, markets finished the year positive in 33 of the 39 instances.
It is very unlikely for investors, professional or amatuer, to be able to identify in advance which days, weeks, or months markets will produce negative returns.
The few that have been able to successfully profit from timing the market, have shown little ability to continue to be consistent with their strategies in the future.
However, by getting out of the market in an attempt to avoid a drawdown, investors run the risk of missing out on times where markets are strongly positive. The past year notwithstanding, markets often reward investors over very short time periods.
To help illustrate this point, the graph below shows how missing out on some of the best days of the market can significantly hamstring total returns over the long-term. Each bar represents the hypothetical growth of $1,000 since 1990 if that investor had missed the best days of the market over the 18 year period.
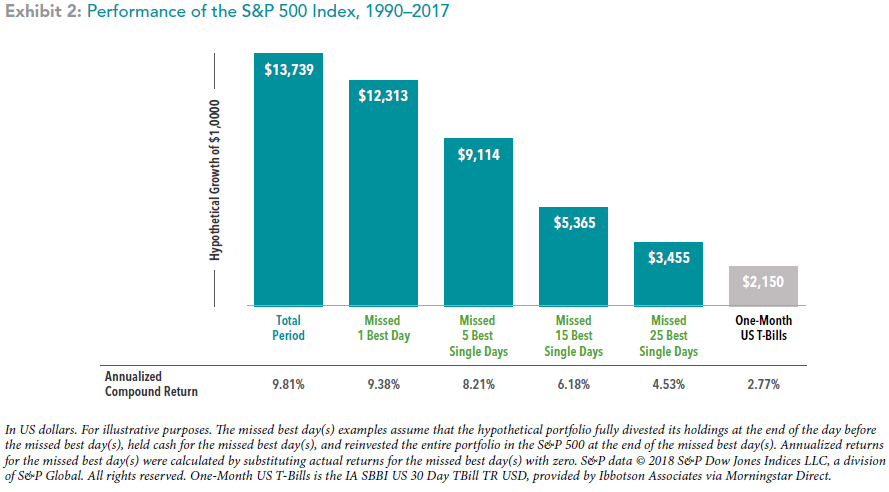
To further confound the efforts of market timing, these best days frequently are found in periods of high volatility – the very times when investors’ fears has them running for the exits.
We’ve had a few friends and family members ask “So, have you been getting a lot of client calls about this dip?” and they’re surprised to hear that our answer is “No, not really.”
Our job, as advisors, is not only to help our clients grow and preserve wealth, but to help them understand the role their investments play in their overall financial plan.
We design portfolios for our clients that seek to maximize their return commensurate with the amount of risk their individual objectives and emotions can bear. Our clients understand that a market correction is part of the natural order of investing.
The key is that drawdowns, like this, are already built into the plan we’ve laid out for them. It’s my hope that most of our clients can see the red arrows pointing down on the news the past few days and simply think “Well, this doesn’t affect my goals” and change the channel.
Once you determine that it might be time to work with a financial advisor, it’s important to find the right advisor for you and your family. We’ve put together a guide of questions that are essential to ask an advisor before you hire them.
20 Questions to Ask a Financial Advisor
Don’t make a mistake by working with the wrong financial advisor. Ask the right questions the first time to determine if a financial advisor is right for you.
If you’re looking for a wealth manager and financial advisor that puts you first, call Ferguson-Johnson Wealth Management today!
CONTACT US
 Optimized by Seraphinite Accelerator